Most users with an administrative role in iLab system will be able to utilize the reporting functionality. Reporting allows users to generate reports on much data underlying the iLab workflow, but in all cases their access to this data is restricted to the data they have control over (e.g. a core manager can report on all data for their core, while a PI can report on all data relevant to their lab/group).
- Access the reporting interface
- Overview of reporting
- Report types
- Open a report
- Report settings
- Configure exhibits
- Filter report data
- View report exhibits
- Report actions
Access the Reporting Interface
The reporting interface can be accessed for all administrative users from the left-hand navigation:
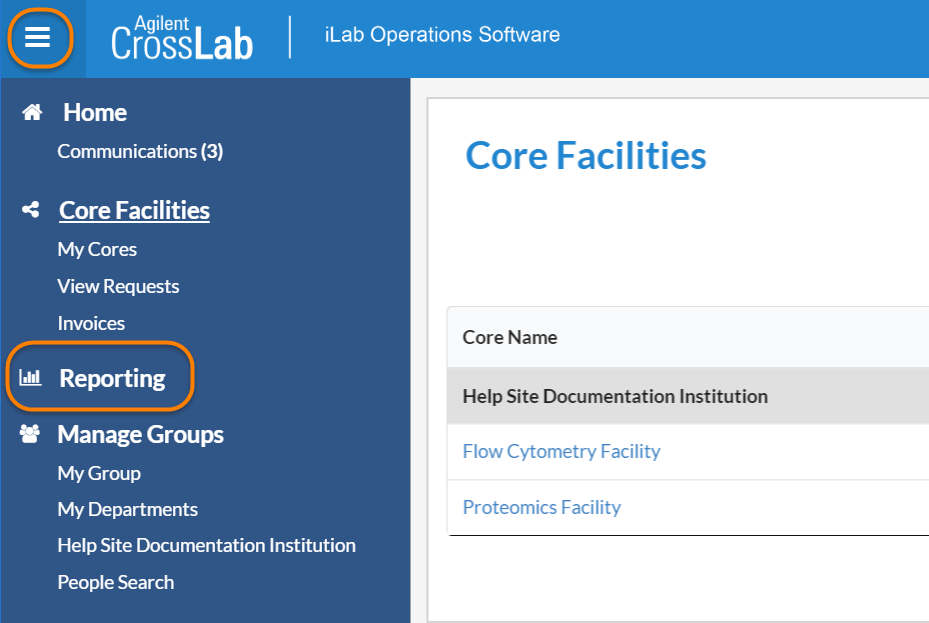
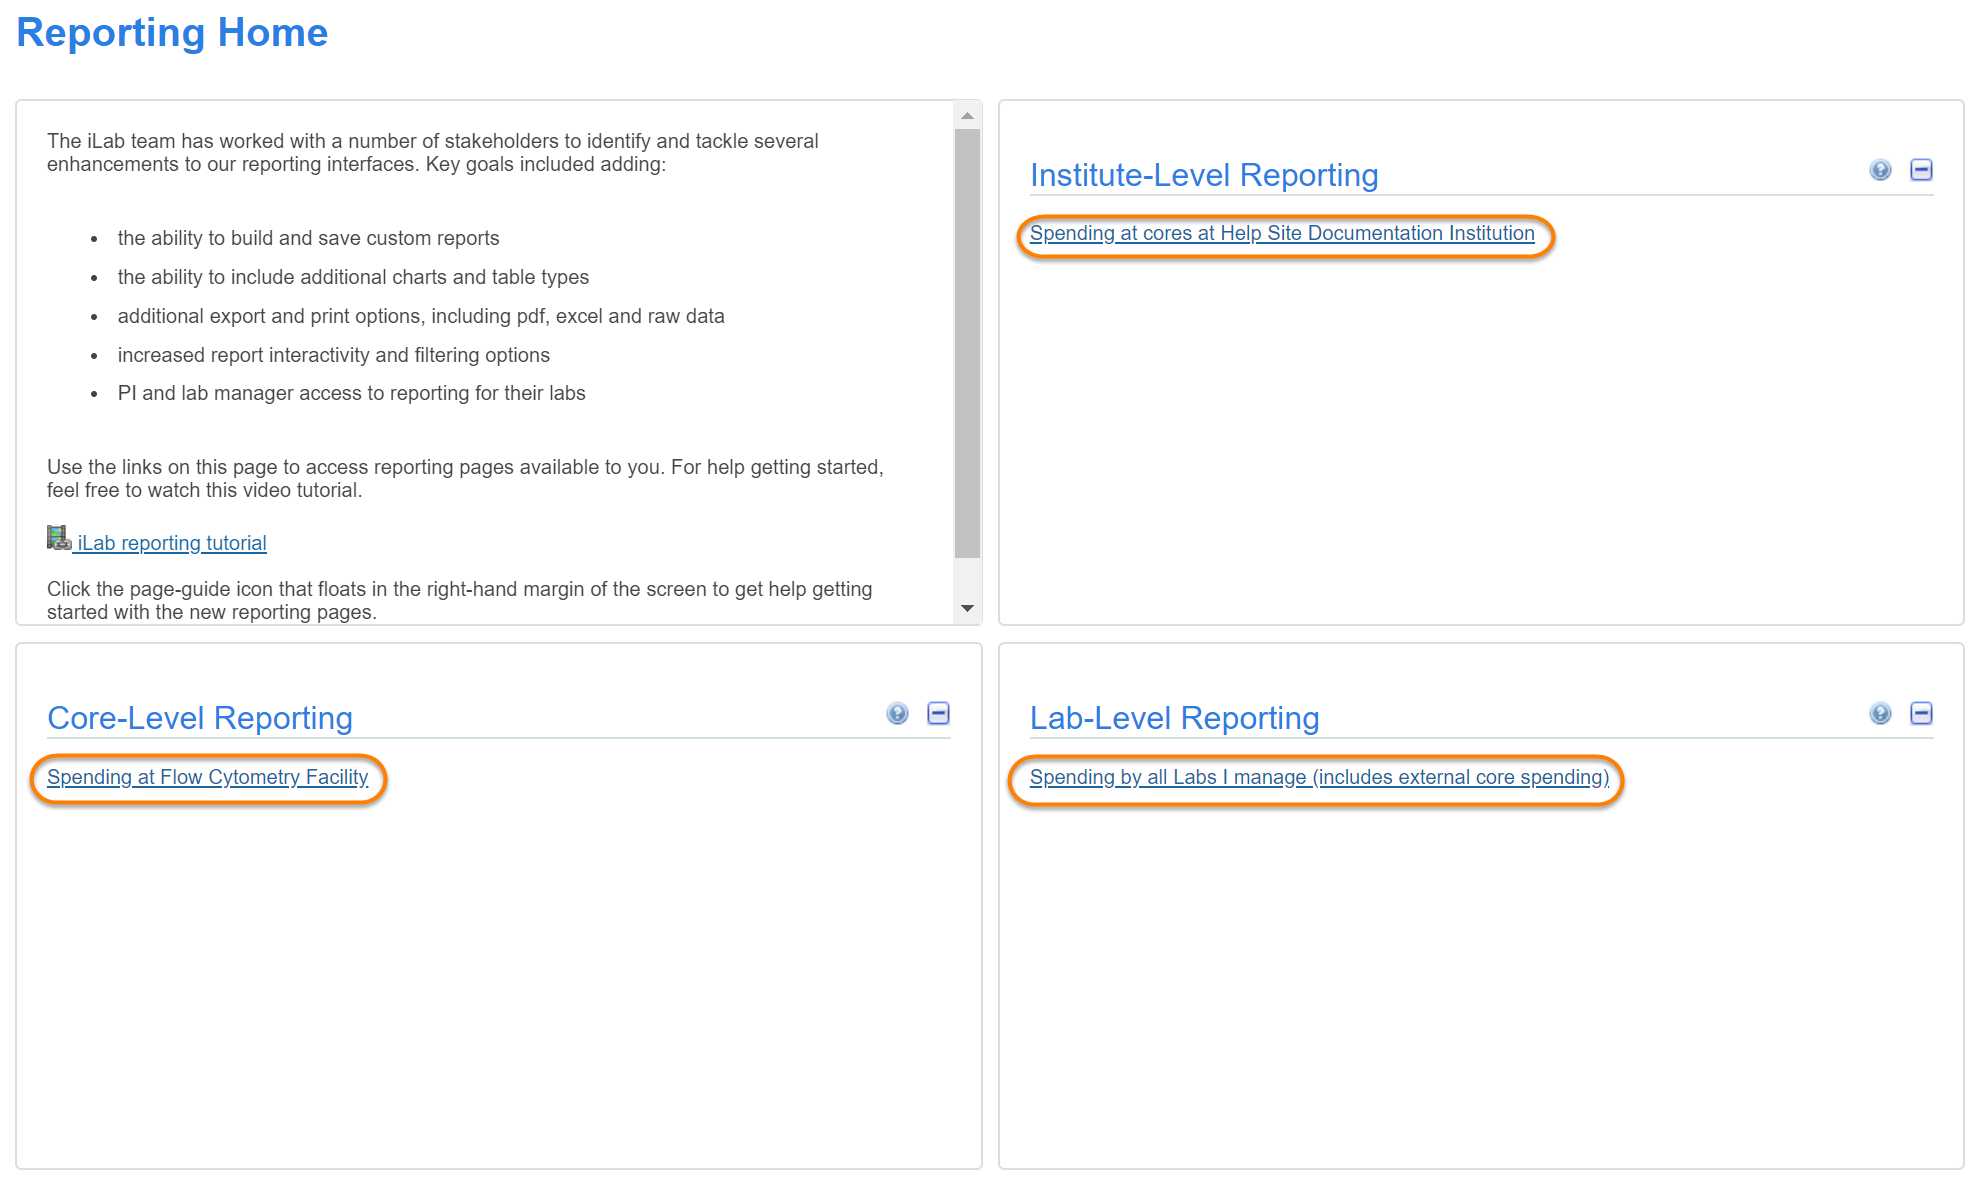
This will open the Reporting Home page, where you can select the various types of reporting available to you, based on your role. Note that the reporting interface is identical for all roles, the only difference is in the data that will be included in the generated reports. From Reporting Home you can access general reporting, as well as any reports you have saved (discussed below).
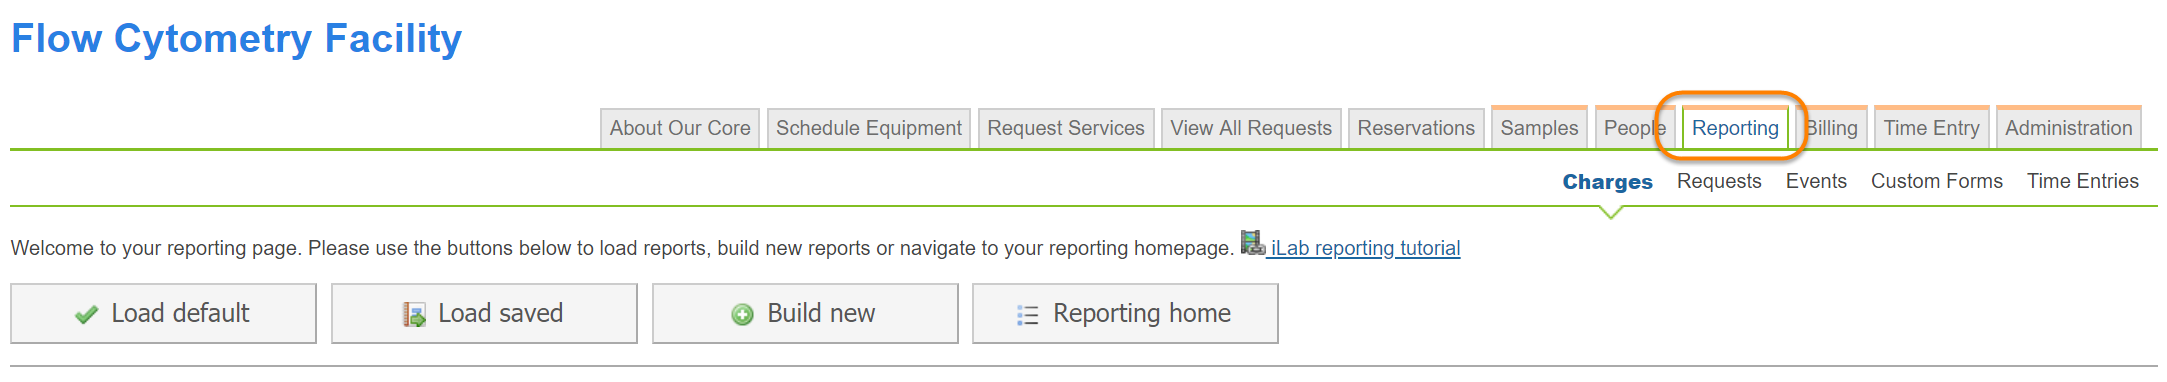
As a Core Administrator, you can access core reporting directly from your Core :
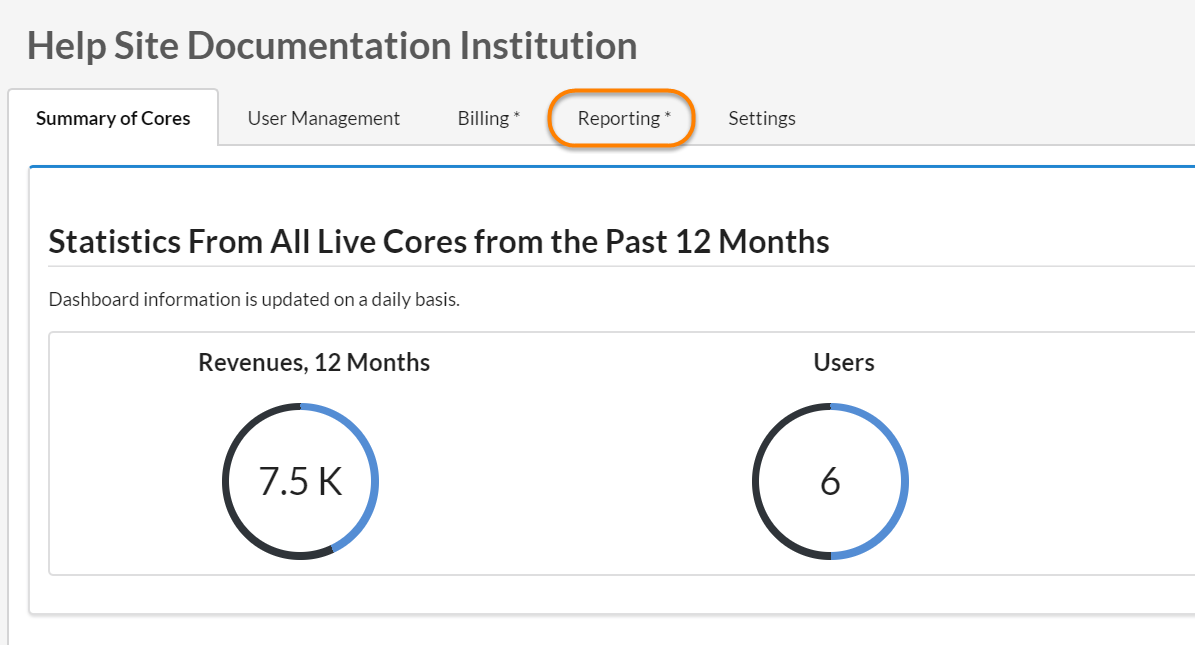
As a System Administrator, you can also access institutional reporting directly from your Institutional Dashboard:
Overview of Reporting
The reporting interface consists of a number of panels. Note that certain panels are not available for all report types (e.g. Custom Forms only has a Report Setting panel).
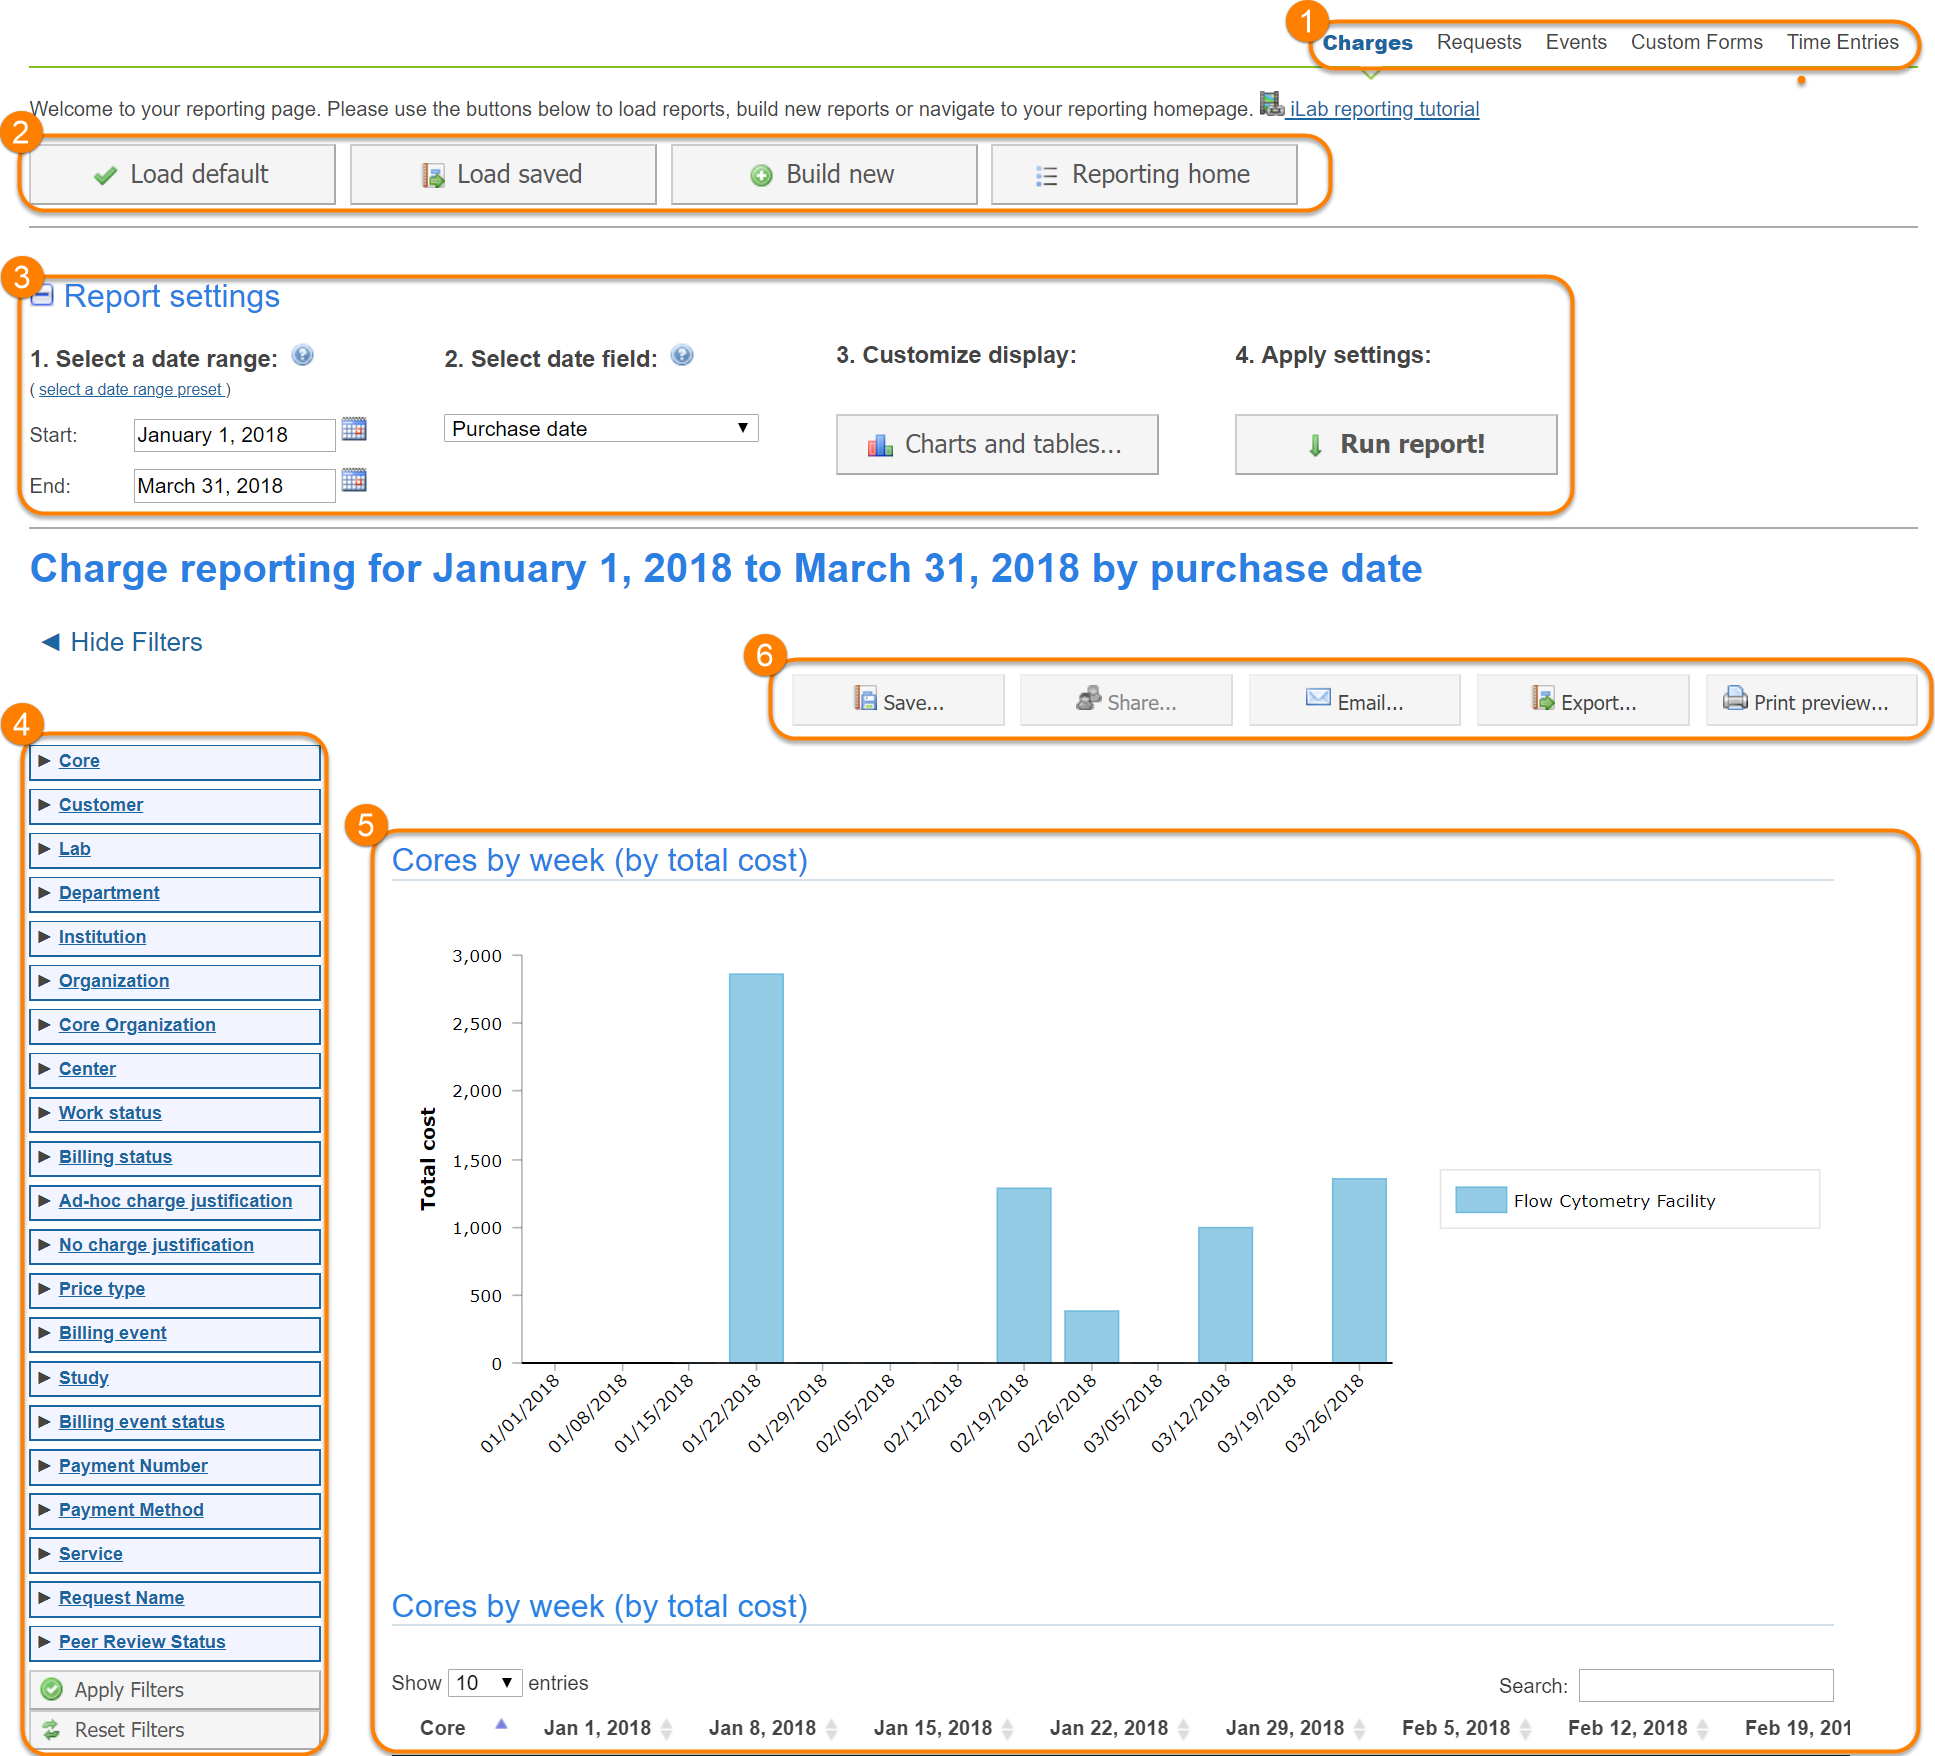
- Report type: iLab provides reporting on a range of different data sets, including charges, requests, events, custom forms and time entries and requisitioning, if applicable.
- Open report: Load the default report or a saved report, create a new report or return to the Reporting Home interface.
- Report settings: Configure reporting time frames and the exhibits that show in the report.
- Filter data: Filter the data included in the report.
- View exhibits: View and manage the exhibits included in the report.
- Report actions: Save reports, share access, e-mail the report, export report data and print the report.
Report Types
iLab provides a range of report types:
- Charges: report on the individual financial charges generated by core facilities, e.g. quantify, price, type, timing, etc.
- Requests: report on data related to service requests, e.g. projected/actual cost, average completion time, etc.
- Events: report on data related to scheduled events, e.g. scheduled/actual time, scheduled/actual cost, etc.
- Custom Forms: download data captured in Custom Forms.
- Time Entries: report on Time Entry data
- Requisitioning: report on data related to requisitioning
The first three report types, Charges, Request and Events, are the core of iLab reporting, and function very similarly. The key difference is the type of data that can be reported on and exported, as discussed in more detail in Reporting Field Details .
The Custom Forms report is only available for core-level reporting and provides a mechanism to download the fields of custom forms used by that core:
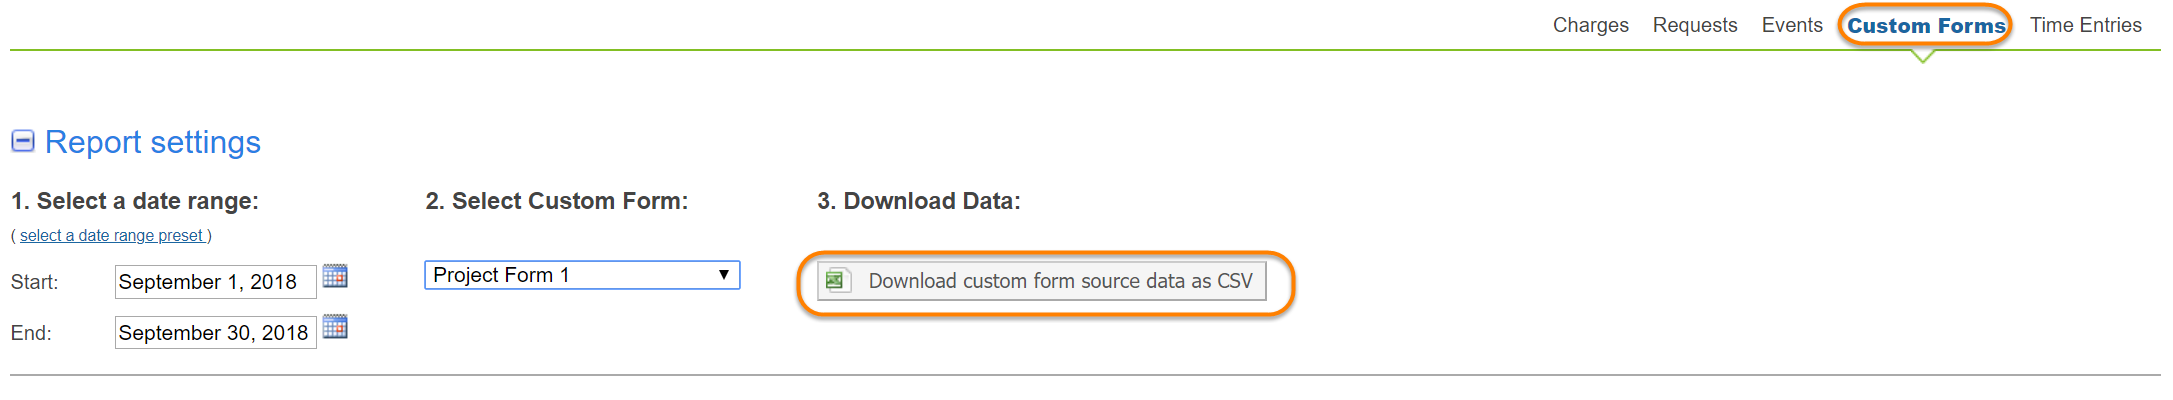
Select a date range under section 1, pick a form used by this core under section 2, and click the "Download custom form source data as CSV" button to download the form fields as completed by the users of the core. Note that currently, only the following data field types are supported for download: small text box, large text box, date, pull-down menu, attachment (name of file only), radio buttons, check boxes, charges, tables.
The Time Entries report is another core-level report that provides reporting on Time Entry data (if enabled for the core):
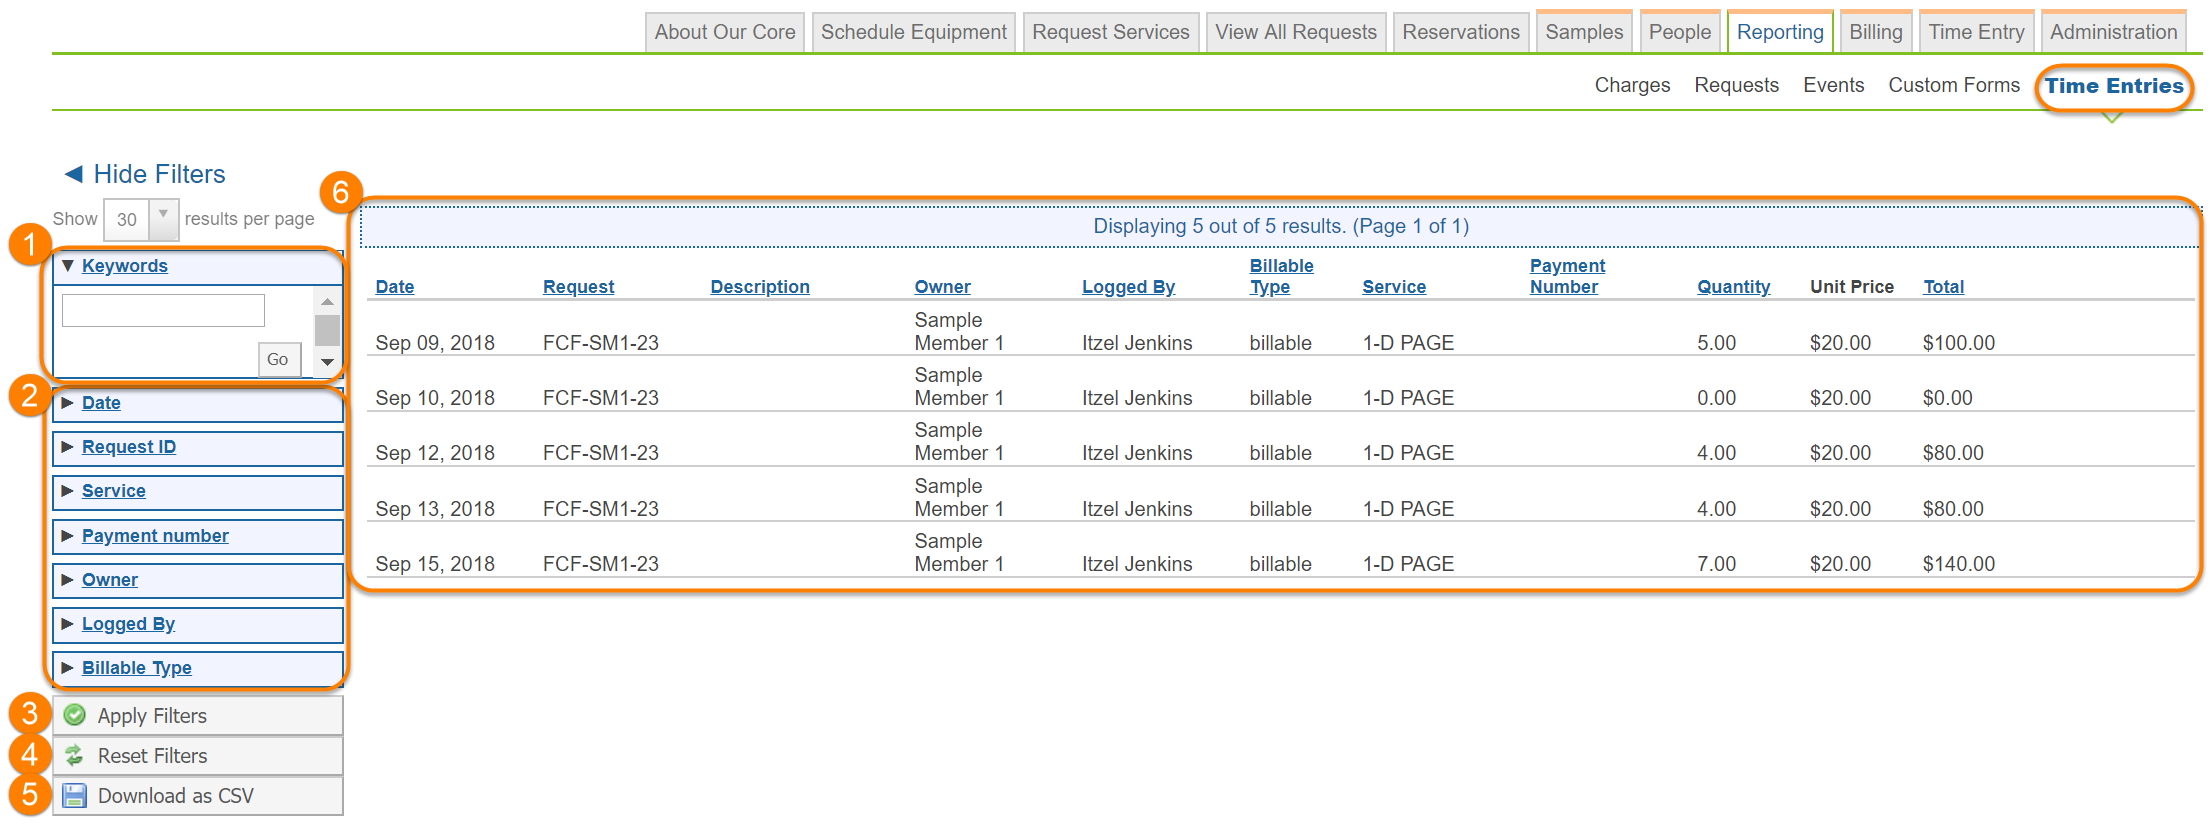
- Keywords: find specific time-entry charges based a keyword that may appear in any of the fields associated with that charge.
- Filters: Select one or more filter criteria to narrow down the time-entry charges included in the report. Expand a criteria by clicking on the little arrow, and then use the check boxes to determine which specific entries to include.
- Apply Filters: Apply the filters selected above to the report.
- Reset Filters: Remove all applied filters.
- Download as CSV: Create a file that includes all the (filtered) time-entry charges.
- View charges: show all the time-entry charges based on the applied filters.
Open a Report
To access or start a report, you have four options:

- Load default: Populate a report with default settings and exhibits.
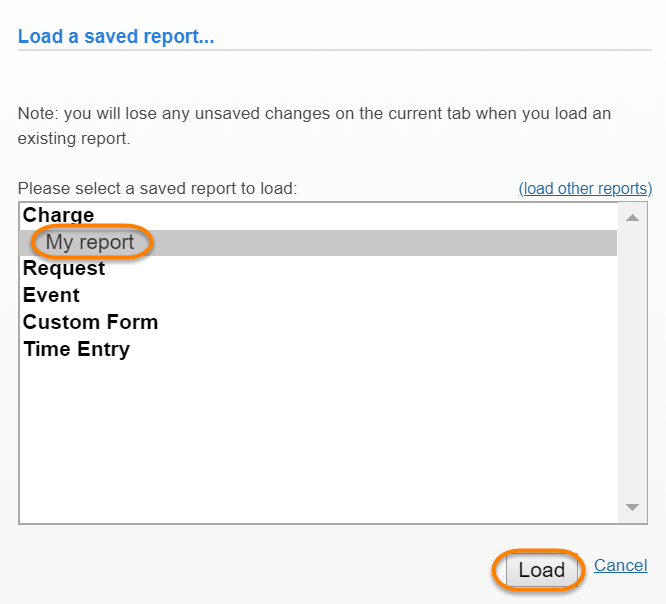
-
Load saved: Select a previously saved report (see Report Actions) and click "Load". Note, you can adjust the dates of a saved report to load new data points into your preferred format.
- Build new: Clears the current report and start building a new report, using the default report as a starting point.
- Reporting home: Go to the Reporting Home page, shown under the Access Reporting Interface.
Report Settings
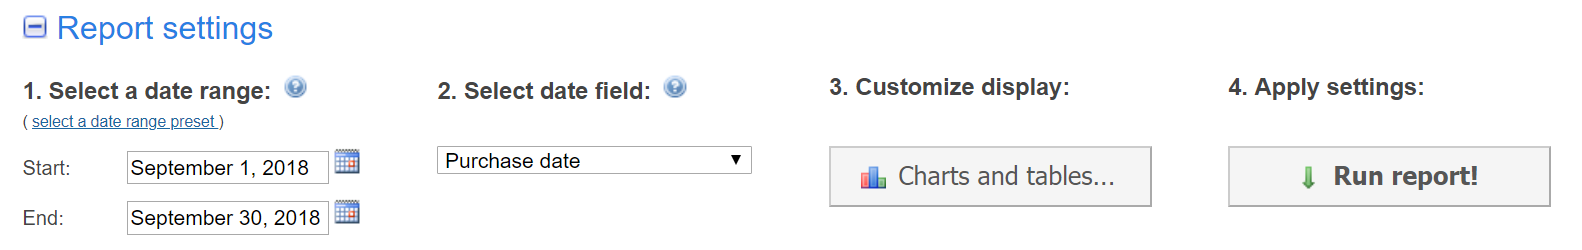
Most reports require the user to specify the following settings:
-
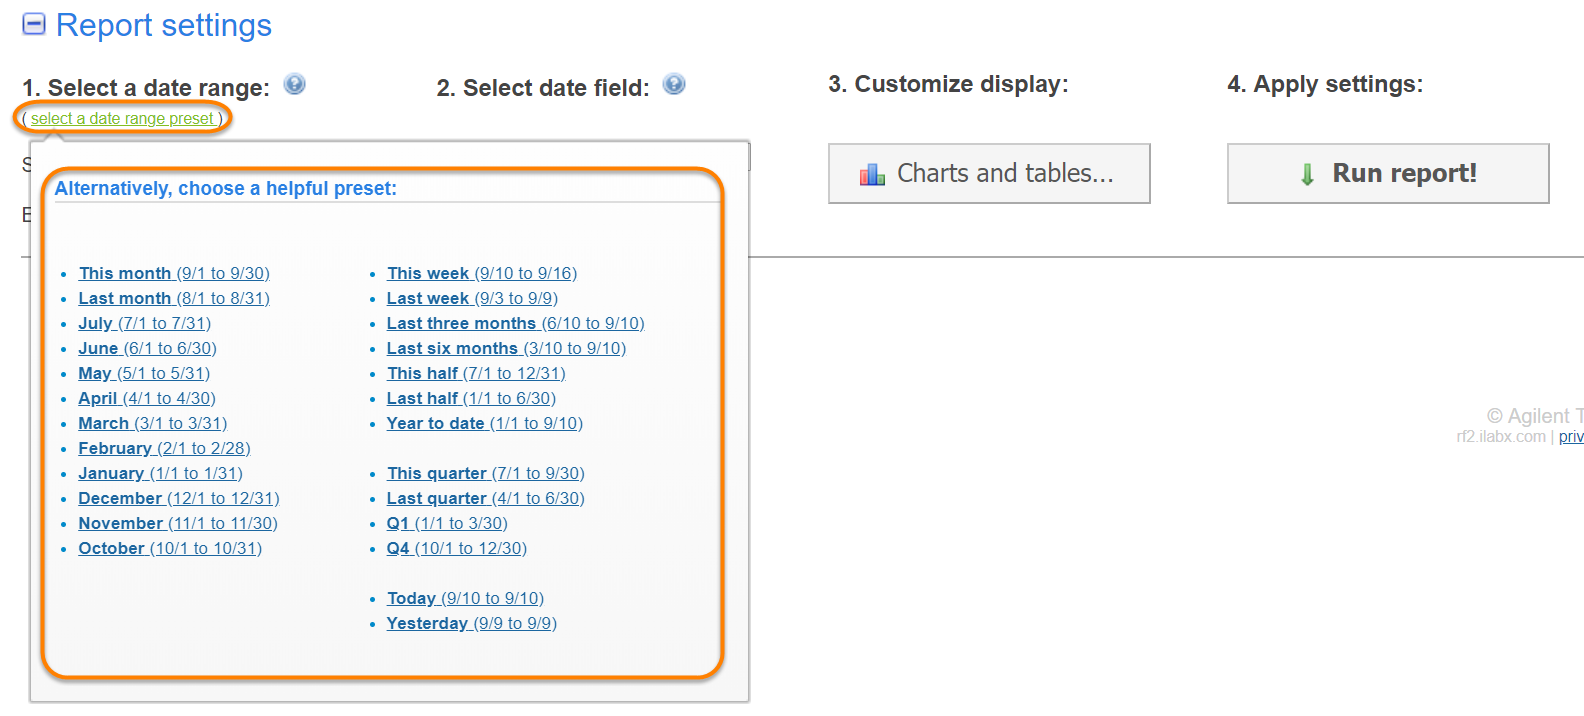
Select a date range: Pick a start and end date you want to use for the report. Alternatively, click on the "select a date range preset" link to open up a number of pre-configured date ranges:
- Select date field: For Charge and Requests reports, this field lets you select the date to used for each item in the report. For a Charge report, you can choose to show the charges by purchase date (when the charge was created), completion date (when the work the charge is associated with was marked as completed) and billing date (when the billing event the charge is included in was created). For Requests report, you can choose the Submission date (when the request was submitted) and the Completion date (when the request was marked as complete).
- Customize Display: This option allows you to fully customize the exhibits you want to include in the report, as discussed in more detail under Configure Exhibits.
- Apply settings: Click the "Run report!" button to apply the previous settings and generate/update the report. This will show any applicable panels that were not yet visible.
Configure Exhibits
Each exhibit in the report can be fully configured, and exhibits can be easily added and deleted. Note that to change an existing exhibit, you need to first click on the pencil icon in column 9:
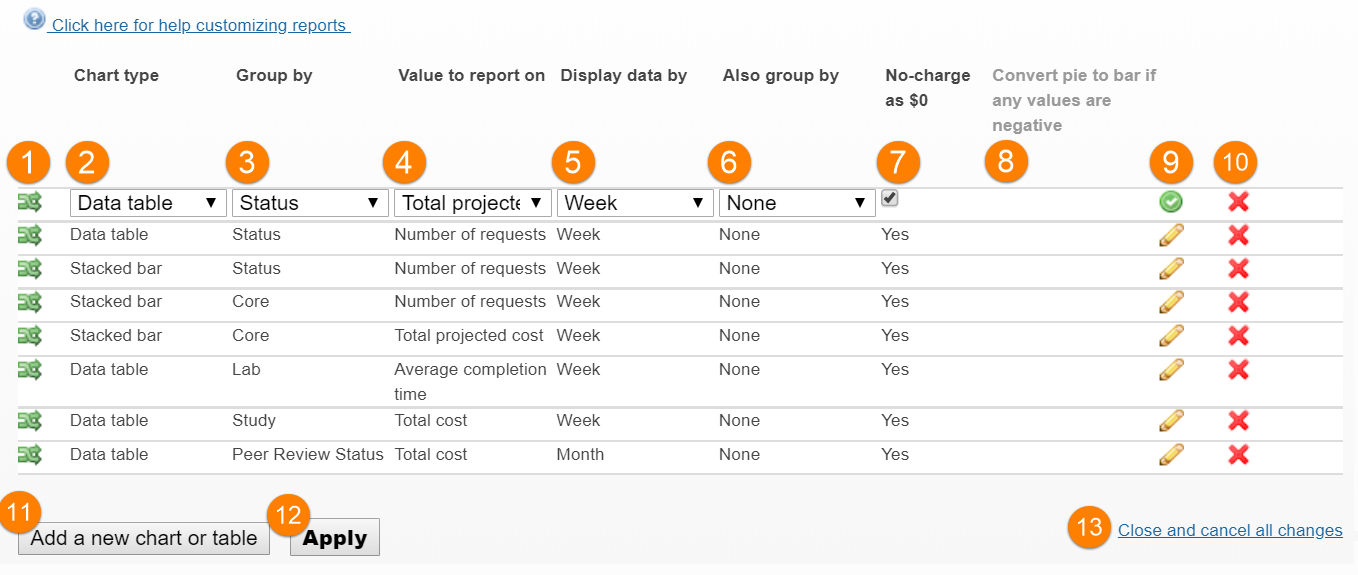
- Move exhibit: The green arrows can be dragged up and down to change the order of the exhibits in the report.
- Chart type: You can choose from a number of typical chart types: stacked bar, line, stacked line, pie, data table.
- Group by: The first grouping applied to the data in the exhibit. For example, select lab to first group charges or requests by the requesting lab.
- Value to report on: Choose the value to show in the report. The options available here are based on the report type, as discussed in more detail in Report Types.
- Display data by: Choose the time frame you would like to use to consolidate data into (e.g. week, month, quarter, day of week, hour).
- Also group by: Apply a second grouping to the data (incremental to item 3). This will create a sub-panel for the second grouping, up to a maximum of 10.
- No-charge as $0: When set to "yes", non-billable and pro-bono charges will be included at $0. Also, no-charge events will be considered to have a price of $0 when calculating scheduled cost. When set to "no", reported totals will include the full value of costs and services provided, even if the customer was not billed for them.
- Convert pie to bar if any values are negative: Only applies to bar charts. When checked, any pie chart with negative value will be converted to a bar chat (so negative values can be shown). When not checked, any negative slices will be excluded.
- Edit exhibit: Click the pencil icon to make edits to the selected exhibit (drop-down options appear in each column that allow the user to change the settings).
- Delete: Delete the selected exhibit (note: you will NOT be prompted for confirmation)
- Add a new chart or table: Adds a new exhibit at the bottom the the exhibit list (can be moved as discussed under item 1)
- Apply: Once you have made any changes to the exhibit you MUST click the Apply button to effect any changes.
- Close and cancel all changes: click this link to close the panel and cancel any changes.
Filter Report Data
The data in most reports can be filtered down to very specific criteria. As an example, the filters for a Charges report are shown below:
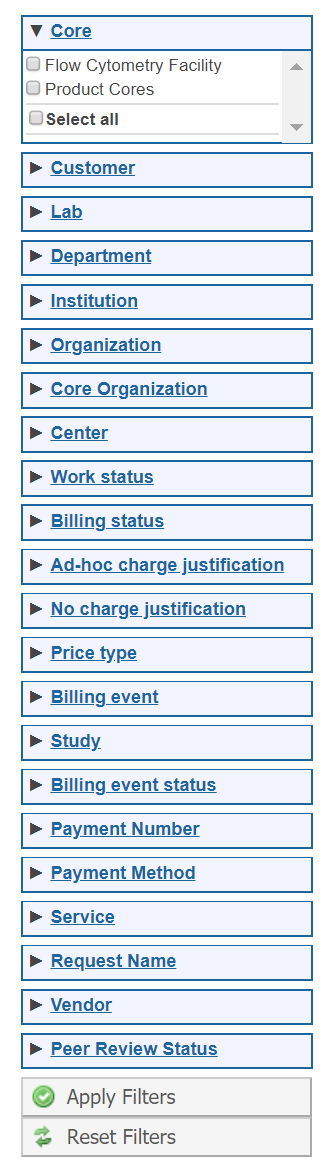
Select one or more filter criteria to narrow down the data included in the report. Expand criteria by clicking on the little arrow, and then use the checkboxes to determine which specific entries to include. For more information on the fields available for each report type, see Reporting Field Details .
Once done configuring the filter, click "Apply Filters". To remove all filters, click "Reset Filters".
View Report Exhibits
The main Exhibit panel shows all the exhibits in the report. An exhibit might look like:
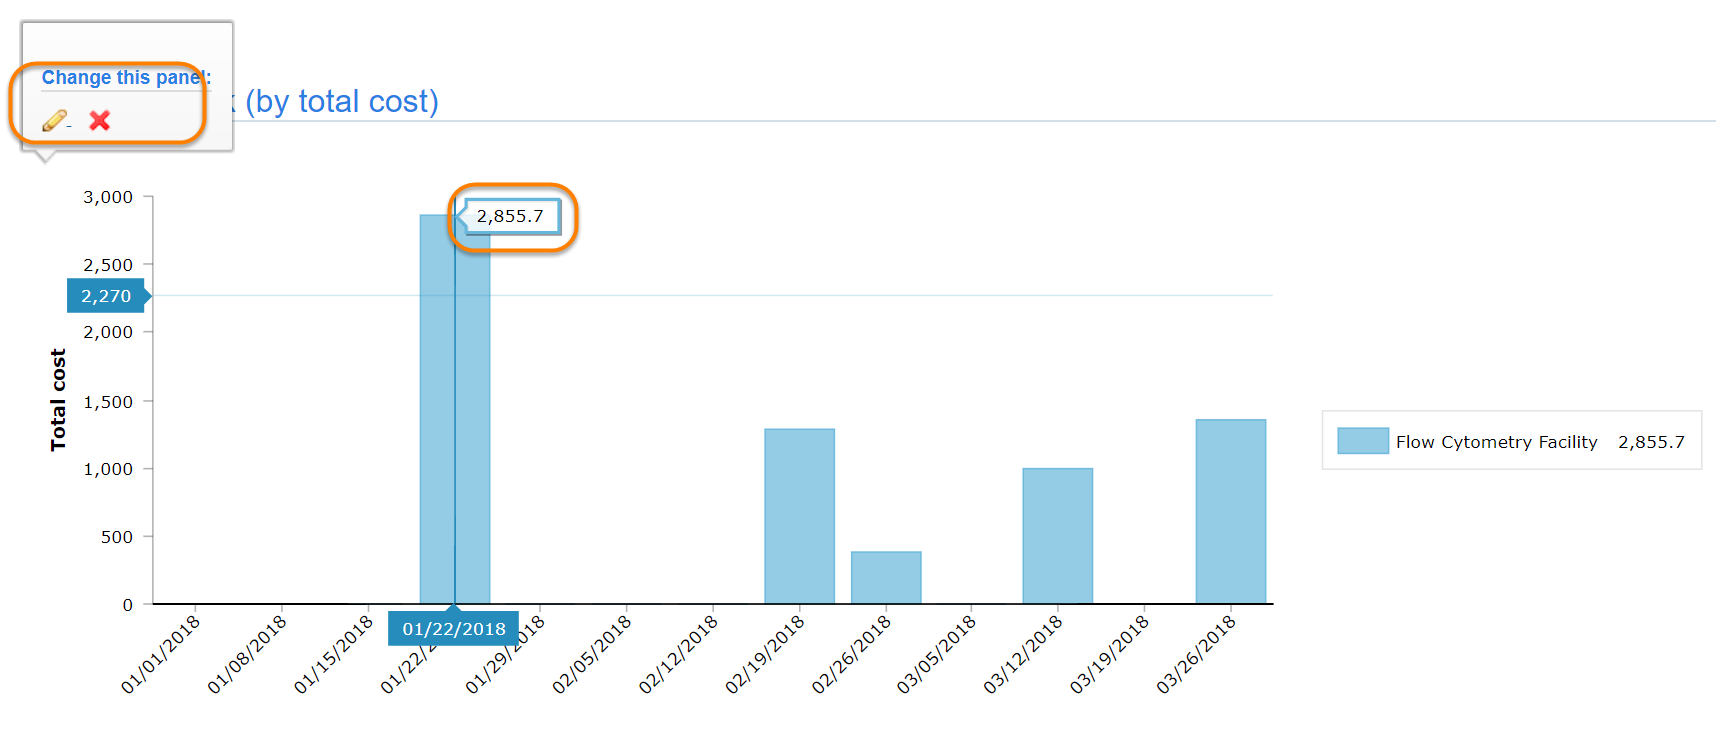
Hover over each exhibit to show a small panel in the upper-left corner with the option to edit the exhibit (this brings up the panel discussed under Configure Exhibits) or to delete it (red X icon). You can also move the mouse over the exhibit to get more detailed information about specific data points.
Report Actions
You have a range of options to further manage the current report and its underlying data:
-
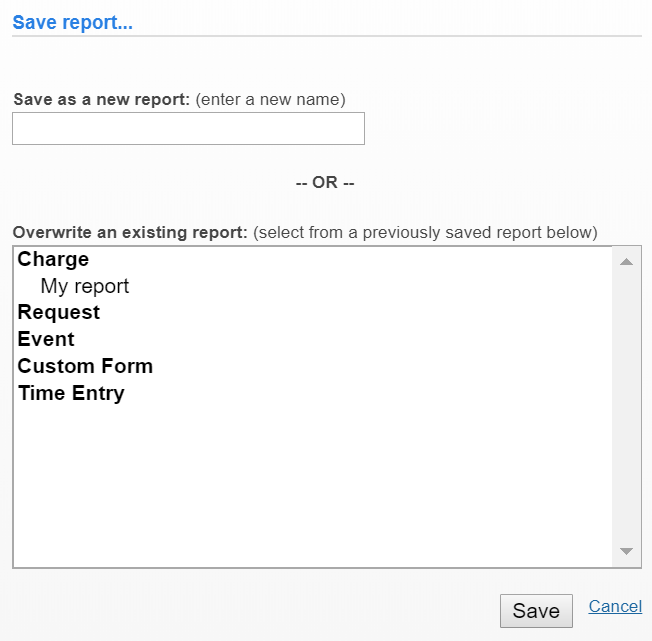
Save: Save this report within iLab, so it can be easily recalled later and be shared with other iLab users. When prompted, provide a name, click "Save", and the report will be saved under the appropriate category. You can also select an existing report to overwrite. To load this same report in the future, you would click on 'Load Saved'.
-
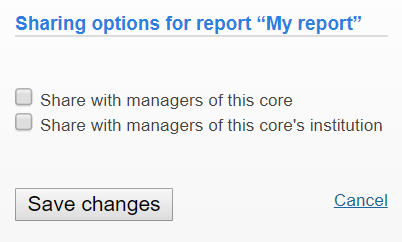
Share: Once a report has been saved, it can be shared with others who also have access to the underlying data. For example, for a core-level report, you might share the report with the other core managers, or with the core's institutional administrators:
-
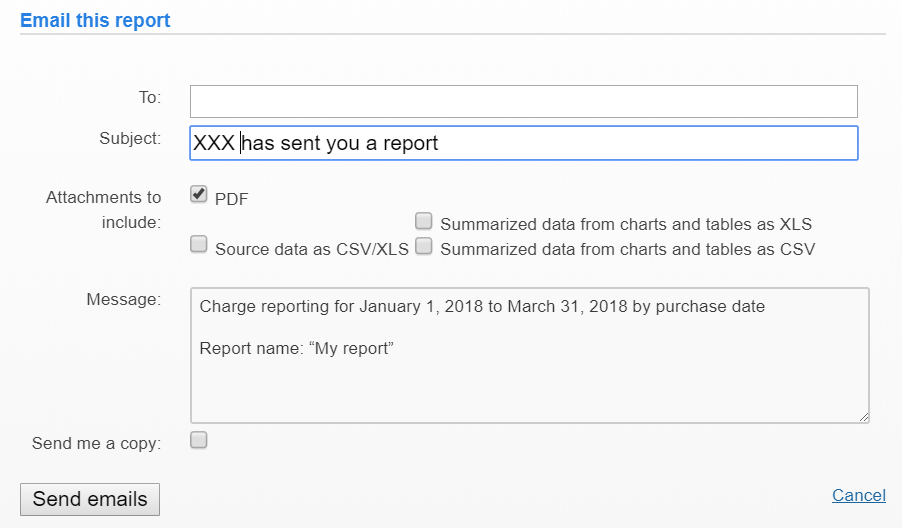
Email: The e-mail option let's you send a copy of the report by e-mail. You can select the recipients and Subject, and also indicate what information to include as an attachment (a PDF version of the report, the underlying source data and/or the data from the individual exhibits as XLS or CSV files). You can customize the message and indicate if you would like a copy sent to yourself.
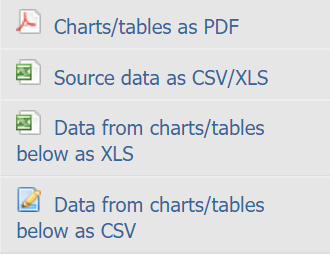
-
Export: The export option lets you download report data in various formats. You can download the charts and tables as a PDF file or you can download the data shown in the various exhibits as either XLS or CSV files. You can also download all of the source data (not just what is shown in the exhibits) in the report date range to a CSV file. This option is typically the most useful for those who are comfortable analyzing complete data sets in other applications (e.g. Excel). See Reporting Field Details for more information about which fields are included in which report.
- Print preview: This option opens up the report in a view that only shows the exhibits, for easy printing directly from your browser.